Turn a messy exploration of the weather readings into a notebook that reads top to bottom: question, imports and parameters, load, clean, summarise, plot, conclusion. Move repeated cells into tested functions and a module, then run the report with no one watching.
P02.9.4L1 Core25 minIn review (what this means)
The maths and code on this page are checked by automated tests on every change, but an independent reader has not signed it off yet. Spot a mistake or a confusing step? Tell us.
Lay out a report notebook in seven steps, from the question to the conclusion, with a sentence of text before each step.
Replace copied cells with a function that checks its own result with an assertion, then move the functions into a module the notebook imports.
Run a notebook headless, with a runner built from json and exec and with jupyter execute, and read a failure.
Explain why every number in a report’s conclusion should be printed by its code.
The question
After an hour of exploring the readings, a notebook holds forty cells: some run, some not, some copied three times with one word changed, one deleted that the others still need. The answer is somewhere in there. How do you turn it into a notebook that someone else can read from the top, rerun with no one watching, and trust?
From the last lesson
1. How does find_root find a project’s folder?
Show answer
It walks up from the current folder through its parents until it reaches one that holds the marker file requirements.txt.
2. Why does a sum of the bytes miss the edit of 21 into 12, while SHA-256 catches it?
Show answer
Addition ignores order, and the edit only swaps the bytes of 2 and 1. SHA-256 depends on the order of the bytes, so its digest changes completely.
Intuition
Exploring and reporting are different jobs. A scratchpad is for finding out: you try things, in any order, and most of them lead nowhere. A report is for telling: one question, the steps that answer it, each said in words and done in code, in the order a reader reads.
P02.9.4-F1
The same work, twice. On the left the counts jump about and nothing says why a cell is there; on the right every step has a heading and a sentence, and the counts run 1 to 6.
The report is not written from nothing. It is the scratchpad with the dead ends deleted, the repeats folded into functions, and the steps put in order. Then comes the test that settles it: a fresh kernel runs the report from top to bottom, and every number and figure must come back.
Build it up
The report answers one question: which station was warmest at noon from 3 to 6 March 2025, and by how much? The readings are the course’s invented weather data.
Step 1. The question, in a text cell at the top. A reader who stops here knows what the notebook is for. Rule et al. (2019) begin with this, Rule 1: tell a story for an audience.
Step 2. Imports and parameters, in the first code cell. Every library, every path, every seed and the data’s expected fingerprint go here, so that changing a setting means changing one cell.
Step 3. Load, and check the data are the ones expected (P02.9.3).
Step 4. Clean. The logger wrote Thursday’s valley reading twice, so the raw file has 13 rows; drop the exact duplicate (P02.5.2).
Step 5. Summarise: the mean temperature per station, by group-by (P02.6).
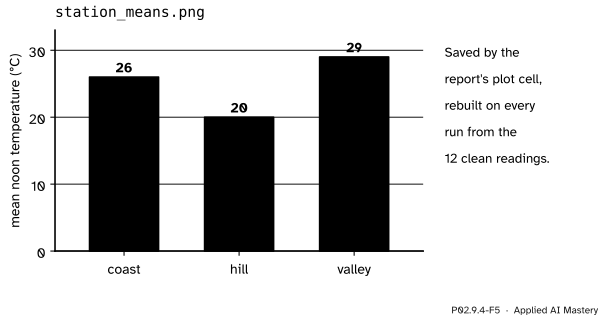
Step 6. Plot, with Matplotlib’s explicit interface (P02.8), and save the figure to a file.
P02.9.4-F5
What the plot cell saves. The file is rebuilt on every run, so it can never disagree with the numbers above it.
Step 7. Conclusion, in words, with each number printed by code just above it.
Before each code cell goes a sentence that says what the step does and why. Rule et al. call this documenting the process, not just the results (Rule 2), and using cell divisions to make the steps clear (Rule 3).
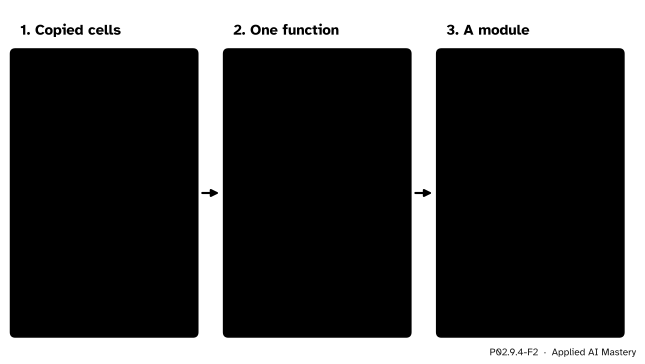
Then the repeats. The scratchpad picked out the coast, then the hill, then the valley with the same line copied three times. Rule 4, modularise code, says: wrap code you are about to copy in a function, and turn code you will reuse in other notebooks or projects into a module.
P02.9.4-F2
From copies to a function to a module. Each function checks its own result with assert (P01.8), so a mistake stops the run where it happens.
The formal statement
NoteDefinition: a reproducible notebook
A notebook is reproducible when a fresh kernel, given
the same data (checked by fingerprint),
the same library versions (pinned),
the same seeds,
runs every code cell once, in page order, without an error, and rebuilds every number, table and figure that its text reports.
Each condition removes one source of difference met in this module. A fresh kernel removes hidden state (P02.9.1); seeds remove chance (P02.9.2); fingerprints and pins remove changed data and changed libraries (P02.9.3). What is left is the code, which anyone can read.
The definition is a test, and a test needs no one watching. The command
jupyter execute report.ipynb
starts a new kernel, runs the cells in page order and stops at the first error. Its exit status is 0 when every cell ran and 1 when one failed, so a script or a build server can run it. Rule et al. (Rule 7) recommend restarting and rerunning all cells as a final test of results, and Rule 9 asks that notebooks be designed to be read, run and explored.
Worked example
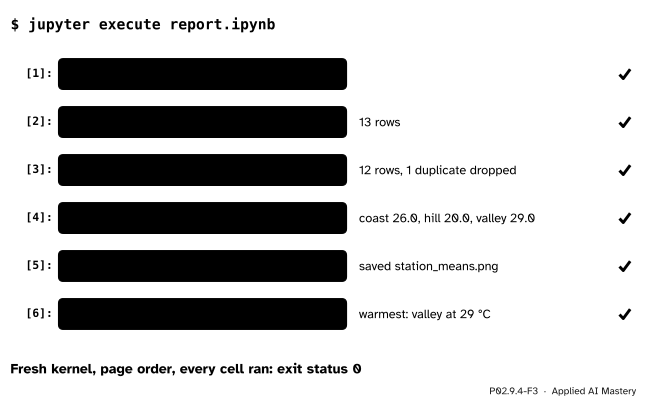
Run the finished report headless and follow it cell by cell.
The project folder holds report.ipynb, the module weather.py beside it, and the raw file data/raw/readings.csv with 13 rows. The kernel starts in the notebook’s folder, so import weather finds the module there.
P02.9.4-F3
The report run with no one watching. Each cell prints the number the text will quote.
Cell 2 reads 13 rows, after load has checked the fingerprint.
Cell 3 drops one duplicate: 12 rows. Without it the valley’s mean would be \({(26 + 28 + 30 + 32 + 32)} / 5 = 148 / 5 = 29.6\), not 29.
Cell 4 gives the station means: coast \(104 / 4 = 26\), hill \(80 / 4 = 20\), valley \(116 / 4 = 29\).
Cell 5 saves the chart of those three means.
Cell 6 prints the conclusion: the valley was warmest, \(29 - 26 = 3\) °C above the coast and \(29 - 20 = 9\) °C above the hill.
Code
First the project: the raw file with its repeated row, and the module. Each function in weather.py asserts something about its own result.
import contextlibimport hashlibimport ioimport jsonimport osimport sysimport tempfilefrom pathlib import PathRAW ="""day,station,temp,skymon,coast,21,rainmon,hill,19,rainmon,valley,26,cloudytue,coast,27,cleartue,hill,23,cleartue,valley,28,cloudywed,coast,27,clearwed,hill,18,cloudywed,valley,30,clearthu,coast,29,clearthu,hill,20,cloudythu,valley,32,clearthu,valley,32,clear"""WEATHER ='''"""Helpers for the weather report: load, clean, summarise, plot."""import hashlibimport matplotlib.pyplot as pltimport pandas as pddef load(path, expected): """Read the raw readings after checking the file's fingerprint.""" assert hashlib.sha256(path.read_bytes()).hexdigest() == expected, "the raw data have changed" return pd.read_csv(path)def clean(readings): """Drop rows that appear twice.""" out = readings.drop_duplicates().reset_index(drop=True) assert not out.duplicated().any() return outdef station_means(readings): """Mean temperature per station.""" means = readings.groupby("station")["temp"].mean() assert len(means) == readings["station"].nunique() return meansdef bar_chart(means): """Bars from zero, one per station.""" fig, ax = plt.subplots(figsize=(4, 3)) ax.bar(means.index, means.to_numpy()) ax.set_ylabel("mean noon temperature (°C)") assert ax.get_ylim()[0] == 0 return fig'''work = tempfile.TemporaryDirectory()project = Path(work.name) /"weather-project"(project /"data"/"raw").mkdir(parents=True)(project /"data"/"processed").mkdir()(project /"data"/"raw"/"readings.csv").write_bytes(RAW.encode("utf-8"))(project /"weather.py").write_text(WEATHER, encoding="utf-8")DIGEST = hashlib.sha256(RAW.encode("utf-8")).hexdigest()print(len(RAW.splitlines()) -1, "raw rows; fingerprint", DIGEST[:12])
13 raw rows; fingerprint 08f0e0b5aafc
Now the report itself, as a notebook file: text cells before code cells, in the seven steps.
def md(text):return {"cell_type": "markdown", "metadata": {}, "source": text}def py(text):return {"cell_type": "code", "execution_count": None, "metadata": {}, "outputs": [], "source": text}report = [ md("# Noon temperatures at three stations\n\nWhich station was warmest at noon, 3 to 6 March 2025?"), md("Imports, paths and the raw file's expected fingerprint."), py("from pathlib import Path\nimport matplotlib.pyplot as plt\nimport weather\n\n"f'DATA = Path.cwd() / "data" / "raw" / "readings.csv"\nOUT = Path.cwd() / "data" / "processed"\n'f'FINGERPRINT = "{DIGEST}"'), md("Load the raw readings; `load` stops if the file has changed."), py('readings = weather.load(DATA, FINGERPRINT)\nprint(len(readings), "rows")'), md("The logger repeated a reading. Drop exact duplicates."), py('clean = weather.clean(readings)\nprint(len(clean), "rows,", len(readings) - len(clean), "duplicate dropped")'), md("Mean noon temperature per station."), py("means = weather.station_means(clean)\nprint(means.to_dict())"), md("The means as bars from zero, saved beside the processed data."), py('fig = weather.bar_chart(means)\nfig.savefig(OUT / "station_means.png")\nplt.close(fig)\nprint("saved station_means.png")'), md("Conclusion, with every number printed by the code."), py('top = means.idxmax()\ngaps = {s: float(means[top] - m) for s, m in means.items() if s != top}\n''print(f"warmest: {top} at {means[top]:.0f} °C, ahead by {gaps}")'),]for k, c inenumerate(report): c["id"] =f"cell-{k +1}"nb = {"cells": report, "metadata": {}, "nbformat": 4, "nbformat_minor": 5}(project /"report.ipynb").write_text(json.dumps(nb, indent=1), encoding="utf-8")print(sum(c["cell_type"] =="code"for c in report), "code cells,", len(report), "cells in all")
6 code cells, 13 cells in all
A headless runner, built from the toy kernel of P02.9.1. It reads the file as JSON, starts the kernel in the notebook’s folder as Jupyter does, forgets any weather imported before (a fresh kernel is a fresh process), runs the code cells in page order and stops at the first error.
def run_notebook(path):"""Run the code cells of an .ipynb file in a fresh dictionary; return what each printed.""" cells = [c for c in json.loads(path.read_text(encoding="utf-8"))["cells"] if c["cell_type"] =="code"] kernel, printed, here = {}, [], Path.cwd() os.chdir(path.parent) sys.path.insert(0, str(path.parent)) sys.modules.pop("weather", None)try:for n, cell inenumerate(cells, start=1):buffer= io.StringIO()try:with contextlib.redirect_stdout(buffer):exec("".join(cell["source"]), kernel)exceptExceptionas error:raiseRuntimeError(f"code cell {n} failed with {type(error).__name__}") from error printed.append(buffer.getvalue())finally: os.chdir(here) sys.path.remove(str(path.parent))return printedfor line in run_notebook(project /"report.ipynb"):print(repr(line))
''
'13 rows\n'
'12 rows, 1 duplicate dropped\n'
"{'coast': 26.0, 'hill': 20.0, 'valley': 29.0}\n"
'saved station_means.png\n'
"warmest: valley at 29 °C, ahead by {'coast': 3.0, 'hill': 9.0}\n"
Every number of the worked example came back from a fresh start. Now the scratchpad: its cells use clean, which a cell that has since been deleted once made.
code cell 3 failed with NameError - name 'clean' is not defined
On your own machine the same test is one command in a terminal, with the project’s environment active (P01.5.4):
jupyter execute report.ipynb # exit status 0: every cell ranjupyter execute scratch.ipynb # stops at cell 3 with NameError, exit status 1
Explore
The run-order sandbox of lesson P02.9.1 is the report’s test in miniature. Run its cells in a messy order, then press Restart and Run All: the read-out says whether the screen matched a clean run. jupyter execute makes the same comparison possible for a whole report.
Pitfalls
P02.9.4-F4
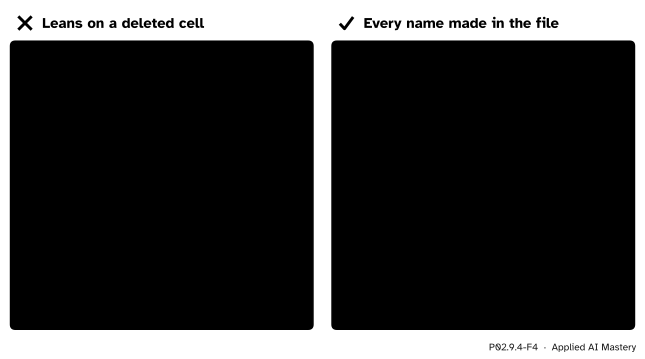
Wrong beside right under jupyter execute. The left notebook worked for its author only because the kernel still held clean; the right one makes every name it uses.
“It ran fine for me, so it is done.”
It ran in a kernel full of hidden state. Only a run in a fresh kernel says what the notebook does by itself. Make jupyter execute the last step before sharing, and the first step when a reader reports a problem.
“I typed the conclusion’s numbers from the output above, so they match.”
They match today. Change the cleaning rule, rerun, and the typed text still says 29 while the code now prints 29.6. Print the numbers the conclusion quotes, as the last cell does, so that a rerun updates them; in a machine learning report this is where a stale accuracy hides.
“I fixed the bug in weather.py, but the notebook still gives the old answer.”
import runs a module once per kernel (P01.5.1), and the kernel keeps the old version. Restart the kernel after editing a module, then run all. A fresh kernel, as in jupyter execute, always imports the current file.
Check yourself
Recall
1. What are the seven steps of the report, in order?
Show answer
Question; imports and parameters; load; clean; summarise; plot; conclusion. Each code step has a sentence of text before it.
2. What does Rule 4 of Rule et al. advise for code you are about to copy?
Show answer
Wrap it in a function and call that from each cell; move functions used across notebooks into a module or package.
3. Why does each function in weather.py end with an assertion?
Show answer
So that a wrong result stops the run at the step that made it, instead of flowing on into the numbers of the conclusion.
4. What does jupyter execute report.ipynb do, and what does its exit status mean?
Show answer
It starts a fresh kernel and runs the code cells in page order, stopping at the first error. Exit status 0 means every cell ran; 1 means one failed.
5. Why should the conclusion’s numbers be printed by code?
Show answer
So that rerunning the notebook updates them; typed numbers go stale when the data or the code change.
Exercises
1.★ Without the cleaning step, what would the station means be? Which conclusion would change, and which would not?
Show solution
Only the valley has the repeated row. Its mean would be \(148 / 5 = 29.6\) instead of 29; the coast stays 26 and the hill 20. The valley is still the warmest, but the gaps would read 3.6 and 9.6 °C instead of 3 and 9: a wrong number in the conclusion, with no error to warn of it.
2.★★ Write sky_means(readings) for weather.py, with an assertion of your own, and give its result on the 12 clean readings.
Show solution
def sky_means(readings):"""Mean temperature per kind of sky.""" means = readings.groupby("sky")["temp"].mean()assert means.index.is_unique andlen(means) == readings["sky"].nunique()return means
On the clean readings it gives clear 28, cloudy 23 and rain 20, from 6, 4 and 2 rows (P02.6.2).
3.★★★ The report reads Path.cwd() / "data". Move report.ipynb into a notebooks/ folder and say what breaks, then fix both the data path and the import of weather with the find_root of P02.9.3.
Show solution
The kernel now starts in notebooks/, so Path.cwd() / "data" points to notebooks/data, which does not exist, and import weather fails because weather.py is not in that folder. In the first code cell, find the root and put it on the import path before importing:
import sysfrom pathlib import PathROOT = find_root(Path.cwd()) # walks up to the folder with requirements.txtsys.path.insert(0, str(ROOT))import weatherDATA = ROOT /"data"/"raw"/"readings.csv"
find_root itself must be defined in that cell (or in a small package installed into the environment), since it is needed before weather can be found.
Summary card
A report is a scratchpad with the dead ends removed, the steps in order, and a fresh run as proof.
P02.9.4-F1
Scratchpad, then report.
Question, imports and parameters, load, clean, summarise, plot, conclusion; a sentence before each step.
Copied code becomes a function with an assert; shared functions go into a module.
Print every number the conclusion quotes.
jupyter execute report.ipynb: fresh kernel, page order, exit status 0.
Sources and next steps
Sources. Each was opened and checked against this lesson on 15 November 2026.
Adam Rule and coauthors, Ten simple rules for writing and sharing computational analyses in Jupyter Notebooks, PLOS Computational Biology 15(7), e1007007, published in 2019: Rule 1, Tell a story for an audience; Rule 2, Document the process, not just the results; Rule 3, Use cell divisions to make steps clear; Rule 4, Modularize code, which advises wrapping code about to be copied in a function and turning code reused across projects into a module or package; Rule 7, Build a pipeline, on restarting the kernel and running all cells as a final test; and Rule 9, Design your notebooks to be read, run, and explored.
Jupyter developers, Executing notebooks, nbclient documentation: the jupyter execute command takes notebooks as arguments, and by default an error stops execution and raises CellExecutionError; --allow-errors runs on to the end instead.
Jupyter developers, The Notebook file format, nbformat 5 documentation: markdown cells and code cells, and the fields each one stores.
Next. Keeping a report’s history with version control is P06.2. A whole analysis from raw table to written findings is S01.8, and a whole machine learning project is ML01.10.