import numpy as np
import pandas as pd

values = np.array([21, 27, 27, 29])
days = ['mon', 'tue', 'wed', 'thu']
picked = values[[3, 0]]
print(values[1], picked)
27 [29 21]Before this lesson: P02.2 Broadcasting and vectorization P02.3 Indexing, slicing and views
The coast station read 21, 27, 27 and 29 degrees at noon on Monday to Thursday. As a NumPy array those are four numbers and nothing else: to find Tuesday’s reading you must remember that Tuesday sits at position 1. Sort the array and that memory is wrong. How can each number carry the name of its day with it, so that no sort, filter or sum can ever separate them?
A Series is a one-dimensional array of values with a label on every value. The labels together are the Series’ index. Picture two columns side by side: the labels on the left, the values on the right, each row a pair that never comes apart.
The numbers in this course are invented for teaching. Three weather stations, coast, hill and valley, are read at noon on four days, Monday 3 to Thursday 6 March 2025, and the days are labelled mon, tue, wed and thu. This lesson uses the coast column alone.
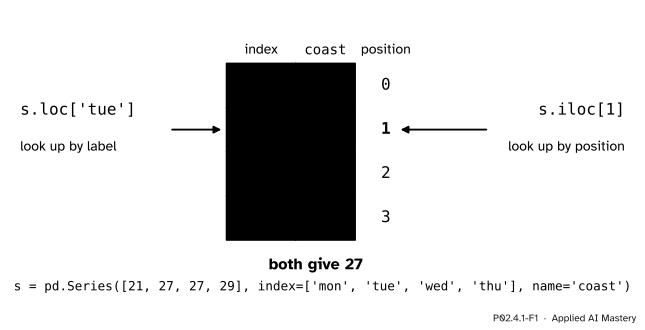
A Series is a column of values with a label on every row. You can reach a value by its label, with s.loc['tue'], or by its position, with s.iloc[1]. Here both reach 27.
The picture shows the two ways in. The NumPy way is by position, a whole number from 0, as in lesson P02.3.1. The new way is by label: you ask for 'tue' and get Tuesday’s reading, wherever Tuesday happens to sit. Labels are what make a dataset readable. A model’s predictions, a column of house prices, the losses of a training run: each is a Series whose index says which example, which house or which step every number belongs to.
Step 1. An array forgets. Start from what P02.1 gave us.
import numpy as np
import pandas as pd
values = np.array([21, 27, 27, 29])
days = ['mon', 'tue', 'wed', 'thu']
picked = values[[3, 0]]
print(values[1], picked)27 [29 21]values[1] is Tuesday only because we remember the order of days. The array itself knows nothing about days. picked holds Thursday’s and Monday’s readings, but nothing in it says so: the moment we pick, sort or filter rows, the link to the days is gone.
Step 2. Labels by hand. Keep the values in the array, and add a dictionary (P01.6.3) that turns each label into its position. A look-up by label is then two look-ups in a row: the dictionary gives the position, the array gives the value.
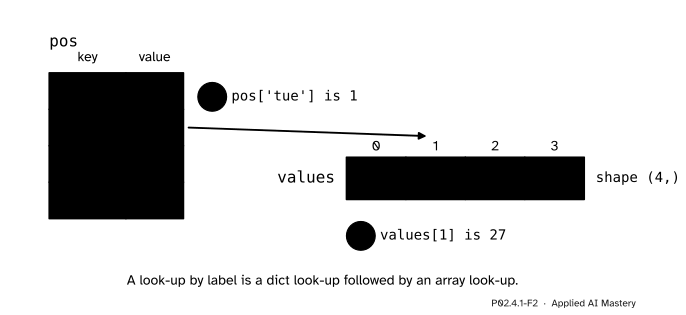
A Series made by hand. Step 1 turns the label into a position with a dictionary, step 2 reads the array at that position.
pos = {}
for i, day in enumerate(days):
    pos[day] = i

def by_label(label):
    return values[pos[label]]

def by_position(k):
    return values[k]

print(pos)
print(by_label('tue'), by_position(1))
{'mon': 0, 'tue': 1, 'wed': 2, 'thu': 3}
27 27Step 3. The real thing. pd.Series takes the values and the labels, and an optional name.
coast = pd.Series([21, 27, 27, 29], index=days, name='coast')
print(coast)
mon 21
tue 27
wed 27
thu 29
Name: coast, dtype: int64Each printed row is a label and its value. The last line names the Series and gives its dtype, the one type that every value shares, exactly as in a NumPy array (P02.1.4).
Step 4. Two ways to look up. coast.loc['tue'] asks for a label and coast.iloc[1] asks for a position; the i in iloc stands for integer position. Both use square brackets, because they are look-ups, not function calls. Plain square brackets, coast['tue'], also look up a label, but loc and iloc say which kind you mean, and from the next lessons on that matters.
Step 5. Arithmetic keeps the labels. Everything P02.2 built for arrays works on a Series, and the labels come along. Converting to Fahrenheit is one line, and each result keeps its day:
print(coast * 9 / 5 + 32)
print(coast.mean(), coast.max(), coast.idxmax(), coast.argmax())
mon 69.8
tue 80.6
wed 80.6
thu 84.2
Name: coast, dtype: float64
26.0 29 thu 3The mean is 26. The hottest reading, 29, has the label 'thu' (from idxmax) and the position 3 (from argmax): the same two ways in, once more.
The two look-ups follow from the definition.
s.iloc[k] is the value at position \(k\), exactly as values[k] is for an array.s.loc[label] first finds the position \(k\) of the label, s.index.get_loc(label), and then returns s.iloc[k]. That is Step 2 again, with pandas doing the dictionary.Each part of a Series has an attribute that reads it.
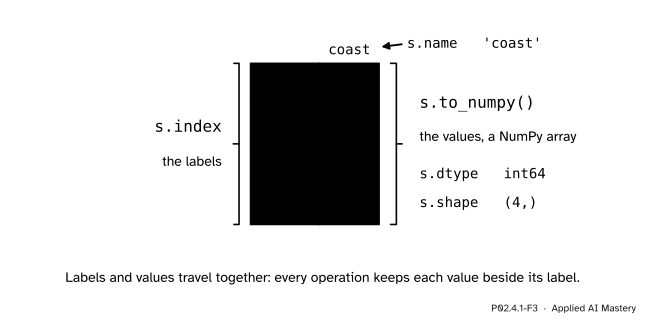
The parts of a Series and the attribute that reads each one.
s.to_numpy() hands back the values as a plain NumPy array, the way back to everything in P02.1 to P02.3. Under pandas 3 the array it returns is read-only, so that changing it cannot quietly change the Series; call .copy() on it if you want to edit the numbers.
Standard deviation, two ways. For values \({x_1, \dots, x_n}\) with mean \(\bar{x}\), the squared distances from the mean add up to
\[ S = \sum_{i=1}^{n} (x_i - \bar{x})^2 . \]
NumPy divides \(S\) by \(n\) before taking the square root; pandas divides by \({n - 1}\):
\[ \begin{aligned} \texttt{np.std} &= \sqrt{S / n}, \\ \texttt{Series.std} &= \sqrt{S / (n - 1)}. \end{aligned} \]
The setting that chooses is called ddof, short for delta degrees of freedom, and the divisor is \({n - \texttt{ddof}}\). NumPy’s default is ddof=0 and pandas’ is ddof=1. Why statistics often prefers \({n - 1}\) for a sample is the subject of S01; here the point is only that the two libraries answer differently unless you say which one you want.
Find the standard deviation of the coast column both ways.
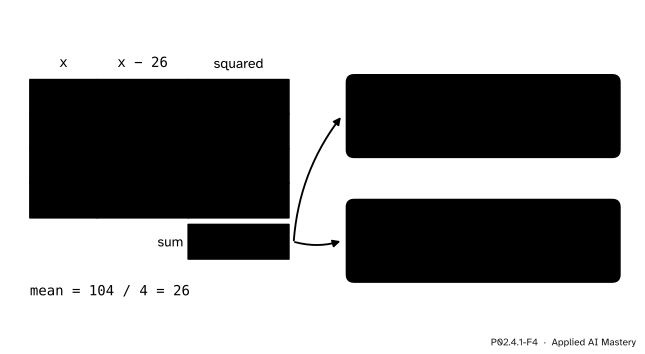
The coast column’s standard deviation, traced by hand. The same sum of squares, 36, divided by 4 gives 3.0 and divided by 3 gives 3.464.
The mean is \({(21 + 27 + 27 + 29) / 4} = {104 / 4} = 26\).
Subtract the mean from each reading: \({21 - 26 = -5}\), \({27 - 26 = 1}\), \({27 - 26 = 1}\) and \({29 - 26 = 3}\). As a check, these distances add to \({-5 + 1 + 1 + 3 = 0}\), as distances from a mean always do.
Square them: 25, 1, 1 and 9. Their sum is \({S = 36}\).
Dividing by \({n = 4}\) gives \({36 / 4 = 9}\), and \({\sqrt{9} = 3}\): this is np.std.
Dividing by \({n - 1 = 3}\) gives \({36 / 3 = 12}\), and \(\sqrt{12} = {2\sqrt{3}} \approx 3.464\): this is coast.std().
First from scratch: a Series is a pair of an array and a position dictionary, so write it as one. A small class (P01.9) keeps the two together.
class LabelledArray:
    """A Series by hand: values, and a dictionary from label to position."""

    def __init__(self, values, labels):
        self.values = np.asarray(values)
        self.labels = list(labels)
        self.pos = {}
        for i, label in enumerate(self.labels):
            self.pos[label] = i

    def loc(self, label):
        return self.values[self.pos[label]]

    def iloc(self, k):
        return self.values[k]

    def std(self, ddof):
        deviations = self.values - self.values.mean()
        S = (deviations ** 2).sum()
        return np.sqrt(S / (len(self.values) - ddof))

mine = LabelledArray([21, 27, 27, 29], days)
print(mine.loc('tue'), mine.iloc(1))
print(mine.std(ddof=0), round(mine.std(ddof=1), 3))
27 27
3.0 3.464Now the library, which should agree on every number.
print(coast.loc['tue'], coast.iloc[1])
print(np.std(coast.to_numpy()), round(coast.std(), 3))
print(coast.std(ddof=0))
print(coast.index.get_loc('tue'), coast.to_numpy().flags.writeable)
27 27
3.0 3.464
3.0
1 Falsecoast.std(ddof=0) asks pandas to divide by \(n\), and then it agrees with NumPy. The last line confirms that the label 'tue' sits at position 1, and that the array from to_numpy is read-only.
This module’s interactive, the label aligner, lives in lesson P02.4.4, where two Series with different labels are added and the labels decide which numbers meet.
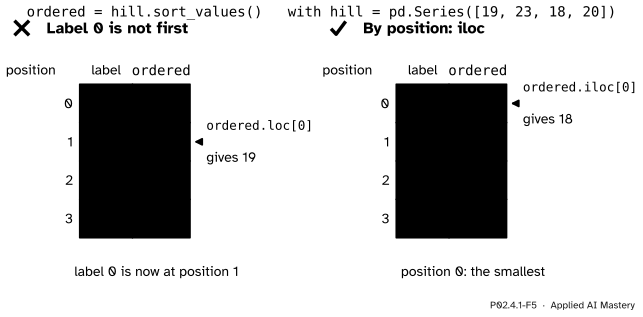
Wrong beside right. After sorting, the label 0 sits at position 1, so ordered.loc[0] is 19, not the smallest value. ordered.iloc[0] asks for position 0 and gets 18.
“Label 0 is the first row.”
Only until the rows move. A Series made without an index gets the labels 0, 1, 2, … and they look like positions. Sort it and the labels go with their values: hill.sort_values() has the labels 2, 0, 3, 1. Then loc[0] (and plain [0], which also reads labels) returns 19, the value whose label is 0. When you mean “the first row”, write iloc[0].
“A standard deviation is a standard deviation.”
np.std divides by \(n\) and Series.std by \({n - 1}\), so the coast column gives 3.0 in one and 3.464 in the other. The gap shrinks as \(n\) grows, but unless every value is the same it never vanishes. When results must match, say which you mean with ddof. Scikit-learn’s StandardScaler, the feature scaling of ML01.3.3, divides by \(n\), like NumPy.
“to_numpy() gives me an array I can change.”
Under pandas 3 it gives a read-only view of the Series’ own numbers, and assigning into it raises ValueError: assignment destination is read-only. Changing a Series goes through the Series (lesson P02.4.3 shows how); if you want an array to edit, take s.to_numpy().copy().
1. What two things does a Series hold, beyond its optional name?
An array of values that share one dtype, and an index: one label for each value.
2. What is the difference between s.loc[x] and s.iloc[x]?
loc looks x up as a label; iloc looks it up as a position counted from 0. loc finds the label’s position first and then reads the value there.
3. How would you build label look-up by hand from a NumPy array?
Keep a dictionary from each label to its position, and read the array at the position the dictionary gives: values[pos[label]].
4. For the coast readings 21, 27, 27, 29, what do np.std and Series.std give, and why do they differ?
3.0 and 3.464. Both start from the sum of squared distances, 36; NumPy divides by \({n = 4}\) and pandas by \({n - 1 = 3}\) before the square root.
5. What is the difference between coast.idxmax() and coast.argmax()?
idxmax gives the label of the largest value, 'thu'; argmax gives its position, 3.
1. ★ Build the hill readings as a Series, hill = pd.Series([19, 23, 18, 20], index=days, name='hill'). Without running code, give hill.loc['wed'], hill.iloc[-1], hill.idxmin() and hill.mean().
hill.loc['wed'] is 18, the value with label 'wed'. hill.iloc[-1] is 20, the last position. hill.idxmin() is 'wed', the label of the smallest value, 18. The mean is \({(19 + 23 + 18 + 20) / 4} = {80 / 4} = 20\).
2. ★★ Find the standard deviation of the hill readings by hand, dividing by \(n\) and by \({n - 1}\). Give each to three decimal places.
The mean is 20. The distances from it are \({-1, 3, -2, 0}\), which add to 0. Their squares are 1, 9, 4 and 0, so \({S = 14}\). Dividing by \({n = 4}\) gives 3.5, and \({\sqrt{3.5} \approx 1.871}\): that is np.std. Dividing by \({n - 1 = 3}\) gives \({4.666\ldots}\), and \({\sqrt{14/3} \approx 2.160}\): that is hill.std().
3. ★★★ Add a method sort_values to LabelledArray that returns a new LabelledArray with the values in increasing order and each label still beside its value. Use it to show that loc(0) and iloc(0) differ for LabelledArray([19, 23, 18, 20], [0, 1, 2, 3]).
np.argsort (P02.3.3) gives the positions in sorted order; pick values and labels with the same positions so that each pair stays together.
def sort_values(self):
    order = np.argsort(self.values, kind='stable')
    labels = [self.labels[k] for k in order]
    return LabelledArray(self.values[order], labels)
For the hill readings, order is [2, 0, 3, 1], so the new labels are 2, 0, 3, 1 and the values 18, 19, 20, 23. Then loc(0) finds the label 0 at position 1 and returns 19, while iloc(0) returns 18: the picture of the pitfall above.
A Series is an array with a label on every value.
Look up by label or by position.
pd.Series(values, index=labels, name=...); read it back with .index, .to_numpy(), .dtype, .name.s.loc[label] is s.iloc[s.index.get_loc(label)].np.std divides by \(n\), Series.std by \({n - 1}\): 3.0 and 3.464 for the coast column.Sources. Each was opened and checked against this lesson on 15 November 2026.
ddof defaults to 1, the divisor is N minus ddof, and ddof=0 (with skipna=False) matches numpy.std.ddof, and by default ddof is zero.numpy.std(x, ddof=0).Next. P02.4.2 A DataFrame: columns that share an index puts three Series side by side.
This lesson unlocks
P02.4.2 A DataFrame: columns that share an index