Tidy data puts each variable in a column and each observation in a row. Turn the wide table of 4 days by 3 stations into the 12 rows of readings with two loops and then with melt, find where every cell lands, and go back with pivot, which sorts the days and refuses a repeated pair.
P02.5.3L1 Core25 minIn review (what this means)
The maths and code on this page are checked by automated tests on every change, but an independent reader has not signed it off yet. Spot a mistake or a confusing step? Tell us.
State the rules of tidy data and say which variable the wide table hides in its column labels.
Turn a wide table into a long one with two nested loops and with melt(id_vars, var_name, value_name).
Work out the row of the long table that any cell of the wide table lands in, for melt’s order and for the order by day.
Turn a long table back into a wide one with pivot, and explain why it sorts the days and fails on a repeated pair.
The question
The wide table of temperatures has 4 rows and 3 columns, and it is easy to read. Yet to plot the temperature of each station, to average by station, or to feed the readings to most tools, you first need the same 12 numbers as 12 rows. Why is that the better shape, and how do you move between the two without losing a value?
From the last lesson
1. What is np.nan == np.nan, and how do you test for a missing value instead?
Show answer
False. Use math.isnan(x) for one number, or s.isna() for a Series.
2. Two files of 6 rows overlap on three rows. How many rows does pd.concat give, and how many does drop_duplicates keep?
Show answer
12 after stacking, 9 after removing the three repeats.
Intuition
The table wide holds the course’s 12 noon temperatures with one row per day and one column per station (P02.4.2). Each number in it is one observation: “at the hill station on Wednesday it was 18 degrees”. That sentence has three parts, the day, the station and the temperature, and those are the table’s three variables.
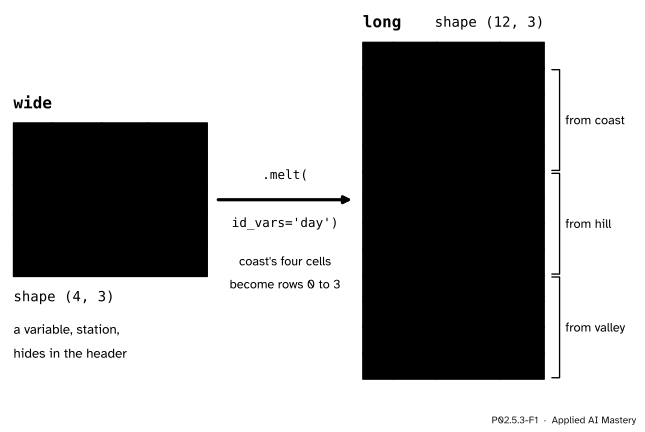
In wide, only one variable, temperature, sits in the cells. The day is in the row labels, and the station is spread across the column labels. The long table gives every variable its own column and every observation its own row.
P02.5.3-F1
Wide to long. Each cell of wide becomes one row of long. The station that was a column label becomes a value in the new column station.
The long table looks repetitive: coast is written four times. But every question is now a question about columns. “Mean temperature by station” is “group the rows by station, average temp” (P02.6). “Plot temperature against day, one colour per station” is “x is day, y is temp, colour is station” (P02.8.4). A machine learning dataset has the same shape: one row per example, one column per feature.
Build it up
Step 1. Name the variables. Day, station, temperature. A table is tidy when each variable forms a column, each observation forms a row, and each kind of observational unit forms a table. wide breaks the first rule: its column labels coast, hill, valley are values of the variable station, not names of variables.
P02.5.3-F2
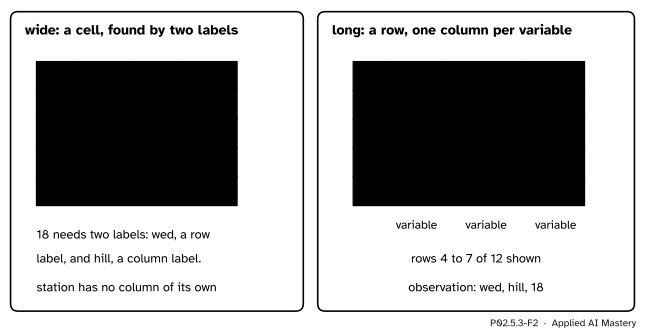
One observation two ways. In wide it is a cell that you find with a row label and a column label; in long it is a row with one column for each of its three variables.
Step 2. Melt by hand. Walk the cells of wide and write one row per cell: two nested loops, one over the stations (the columns) and one over the days (the rows).
Step 3. Melt with pandas.melt does the same walk. It needs to know which columns already are variables and stay as they are (id_vars), and what to call the new columns. The day must be a column first, so reset_index moves it out of the index.
Step 4. Choose the row order.melt walks column by column, so its rows come station by station. The course’s table readings is ordered by day, then station. Same rows, different order.
Step 5. Pivot back.pivot(index="day", columns="station", values="temp") sends every row to the cell named by its day and its station. It is the reverse of melt.
The formal statement
NoteMelt and pivot
df.melt(id_vars="day", var_name="station", value_name="temp") keeps the column day, and turns every other column into rows: one row per (row of df, other column) pair, with the column’s label in station and the cell’s value in temp. It ignores the index.
long.pivot(index="day", columns="station", values="temp") makes one row per distinct day and one column per distinct station, and puts each row’s temp in the cell its (day, station) pair names. The labels come out sorted. If two rows name the same pair it raises ValueError.
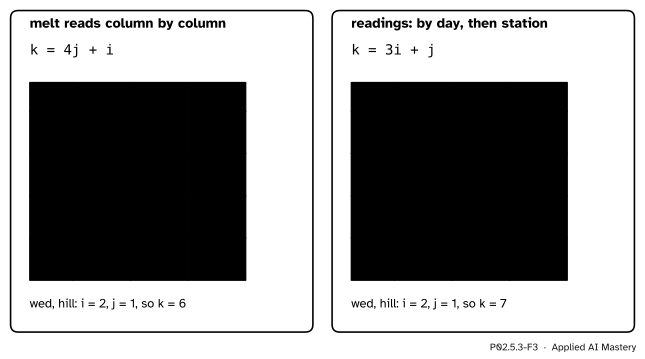
Where each cell lands. Number the days \(i = 0, 1, 2, 3\) and the stations \(j = 0, 1, 2\), as in code. melt writes all 4 days of station 0, then all 4 days of station 1, and so on. Before cell \((i, j)\) come \(j\) complete stations of 4 rows, then \(i\) more rows, so the cell lands in row
\[
k_{\text{melt}} = 4j + i .
\]
Ordered by day, before cell \((i, j)\) come \(i\) complete days of 3 rows, then \(j\) more rows:
\[
k_{\text{day}} = 3i + j .
\]
This is the flat position of P02.1.3: \(k = 3i + j\) is reading wide row by row, and \(4j + i\) is reading it column by column. Going back, division with remainder undoes each rule: in melt’s order the day is \(i = k \bmod 4\) and the station \(j = \lfloor k / 4 \rfloor\).
P02.5.3-F5
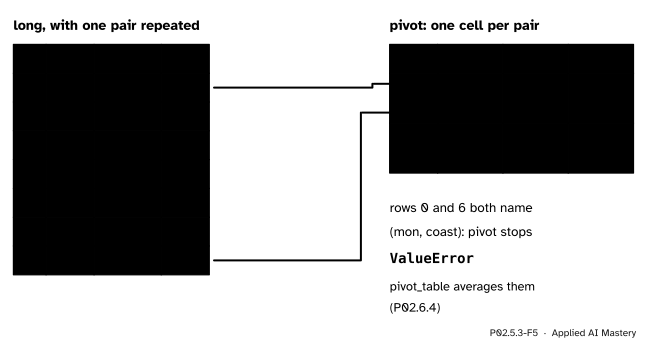
pivot puts each row into the one cell its pair names. When two rows name the same pair, the cell would need two values, and pivot stops.
Worked example
Where does Wednesday at hill, 18 degrees, land in each long table, and which reading is row 9 of melt’s table?
Wednesday is day \(i = 2\) and hill is station \(j = 1\).
In melt’s order: \(k = 4 \cdot 1 + 2 = 6\). Rows 0 to 3 are coast; rows 4, 5 and 6 are hill on Monday, Tuesday and Wednesday. Row 6 is (wed, hill, 18).
In order by day: \(k = 3 \cdot 2 + 1 = 7\). Rows 0 to 5 are Monday and Tuesday; rows 6 and 7 are Wednesday’s coast and hill. Row 7 is (wed, hill, 18).
P02.5.3-F3
Every cell of wide with the row it lands in. Column by column on the left, row by row on the right; the highlighted cell is the worked example.
Day 1 is Tuesday and station 2 is valley, so row 9 is (tue, valley, 28), the value in wide at Tuesday and valley.
Code
The wide table, then melt by hand with two nested loops in the order melt uses.
import numpy as npimport pandas as pdtemps = np.array([[21, 19, 26], [27, 23, 28], [27, 18, 30], [29, 20, 32]])days = ["mon", "tue", "wed", "thu"]stations = ["coast", "hill", "valley"]wide = pd.DataFrame(temps, index=pd.Index(days, name="day"), columns=stations)rows = []for station in stations: # column by columnfor day in days: # then down the rows rows.append({"day": day, "station": station, "temp": int(wide.loc[day, station])})by_hand = pd.DataFrame(rows)print(by_hand.head(5))print(by_hand.shape)
   day station  temp
0  mon   coast    21
1  tue   coast    27
2  wed   coast    27
3  thu   coast    29
4  mon    hill    19
(12, 3)
The same with melt. The day must be a column, so reset_index moves it out of the index first.
long= wide.reset_index().melt(id_vars="day", var_name="station", value_name="temp")print(long.head(5))print(long.equals(by_hand), long.dtypes.to_dict())for i inrange(4): # the rule k = 4j + i, checked on every cellfor j inrange(3):assertlong.loc[4* j + i, "temp"] == wide.iloc[i, j]
The course’s order, by day and then station. A stable sort keeps melt’s station order within each day, and the key maps each day to its place in the week, so that the sort does not go by spelling.
place = {day: i for i, day inenumerate(days)}readings = (long.sort_values("day", key=lambda s: s.map(place), kind="stable") .reset_index(drop=True))print(readings.head(4))print(readings.loc[7].tolist())
   day station  temp
0  mon   coast    21
1  mon    hill    19
2  mon  valley    26
3  tue   coast    27
['wed', 'hill', np.int64(18)]
Back to wide with pivot. Look at the order of the days.
back = readings.pivot(index="day", columns="station", values="temp")print(back)print(list(back.index))print(back.reindex(days).equals(wide))
station  coast  hill  valley
day
mon         21    19      26
thu         29    20      32
tue         27    23      28
wed         27    18      30
['mon', 'thu', 'tue', 'wed']
True
A repeated (day, station) pair: pivot has two values for one cell.
This module’s interactive, the join matcher, lives in the next lesson. The long table you built here is the left-hand table there: each reading looks up its station’s details by the key station.
Pitfalls
P02.5.3-F4
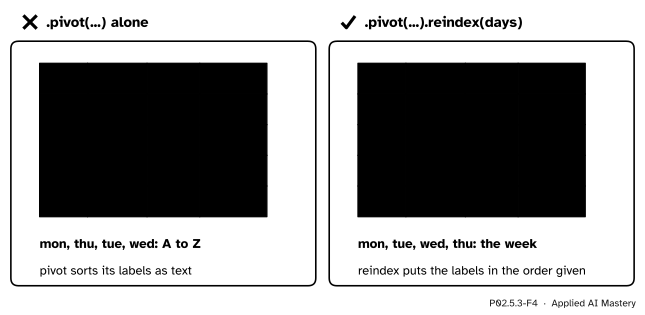
Wrong beside right. pivot sorts the day labels as text, so Thursday comes second. reindex with the list of days puts the week back in order.
“pivot gives back the table I melted.”
It gives back the same cells, with its labels sorted: mon, thu, tue, wed. Put the order back with .reindex(days). (An ordered categorical, P02.7.4, makes the sort itself follow the week.)
“wide.melt() keeps the days.”
melt ignores the index, and in wide the day is the index. wide.melt() gives two columns, variable and value, and no day at all. Call reset_index() first and name id_vars="day".
“pivot can reshape any long table.”
Only one in which each (index, column) pair appears once. Two readings for Monday at coast leave pivot with two values for one cell, and it raises ValueError. pivot_table resolves the clash by combining them, with a mean by default (P02.6.4).
Check yourself
Recall
1. State the three rules of tidy data.
Show answer
Each variable forms a column, each observation forms a row, and each type of observational unit forms a table.
2. Which variable does wide hide in its column labels?
Show answer
The station: coast, hill and valley are its values.
3. In melt’s table, which row holds the cell of day \(i\) and station \(j\)?
Show answer
Row \(4j + i\): \(j\) whole stations of 4 rows come first, then \(i\) more rows.
4. In what order does pivot put the day labels, and how do you restore the week?
Show answer
Sorted as text, mon, thu, tue, wed. Restore it with .reindex(["mon", "tue", "wed", "thu"]).
5. When does pivot raise ValueError?
Show answer
When two rows have the same (index, column) pair, so one cell would need two values.
Exercises
1.★ In which row does Tuesday at valley land in melt’s table, and in which row of readings?
Show solution
Tuesday is \(i = 1\) and valley is \(j = 2\). In melt’s table \(k = 4 \cdot 2 + 1 = 9\); in readings\(k = 3 \cdot 1 + 2 = 5\). Both rows hold 28.
2.★★ Find the rule that undoes \(k = 3i + j\), and use it to name row 7 of readings.
Show solution
Since \(0 \le j \le 2\), the number \(3i\) is the largest multiple of 3 not above \(k\). So \(i = \lfloor k / 3 \rfloor\) and \(j = k - 3i = k \bmod 3\). For \(k = 7\): \(i = 2\) (Wednesday) and \(j = 1\) (hill), and the row is (wed, hill, 18).
3.★★★ Suppose the hill reading for Tuesday is missing in wide. How many rows does melt give, and how many are left after dropna()? Pivot the 11 rows back to wide: what stands at (tue, hill), and what is the dtype of the column hill?
Show solution
melt still makes one row per cell: 12 rows, one with temp missing. dropna() removes it, leaving 11. When pivoting back, no row names the pair (tue, hill), so that cell is empty and pandas writes NaN there. Since NaN is a float, the column hill is float64 (and in fact all three are, because the temp column became float64 as soon as it held a NaN). Melt and pivot lose nothing and invent nothing: a hole goes in, a hole comes out.
Summary card
Long form gives every variable a column and every observation a row.
P02.5.3-F1
Each cell becomes one row.
Tidy: each variable a column, each observation a row (Wickham 2014).
Cell \((i, j)\) lands in row \(4j + i\) (melt) or \(3i + j\) (by day).
pivot(index, columns, values) goes back; it sorts labels and needs each pair once.
Sources and next steps
Sources. Each was opened and checked against this lesson on 15 November 2026.
Hadley Wickham, Tidy Data, Journal of Statistical Software 59(10), 2014. Section 2.3 gives the three rules (each variable forms a column, each observation forms a row, each type of observational unit forms a table); section 3.1 treats the first common problem, column headers that are values rather than variable names, and fixes it by melting.
The pandas development team, Reshaping and pivot tables, pandas 3.1.1 User Guide: melt turns the columns that are not identifier variables into rows, with names set by var_name and value_name, and ignores the index; pivot can handle only unique rows for the given index and columns, and pivot_table handles duplicates.
The pandas development team, pandas.DataFrame.melt and pandas.DataFrame.pivot, pandas 3.1.1 API reference: the parameters id_vars, var_name, value_name and ignore_index, and the ValueError raised when an index and column pair has several values.