Use time as a group key. Compute weekly means of a fortnight of temperatures with a dict, then with resample(‘W’); slide a 3-day window by hand, then with rolling(3); build lag features with shift and diff, and see why a centred window leaks the future.
P02.7.2L1 Core25 minIn review (what this means)
The maths and code on this page are checked by automated tests on every change, but an independent reader has not signed it off yet. Spot a mistake or a confusing step? Tell us.
Compute weekly means by hand with a dict keyed by week, and with resample(‘W’), explaining why each week is labelled by its closing Sunday.
Compute a trailing rolling mean with a loop and with rolling(w), and count the missing values at the start.
Derive the update rule of a rolling mean, one value in and one value out, and use it to check a result.
Build lag features with shift(1) and diff(), and explain why a centred window leaks the future into a feature.
The question
You have 14 noon temperatures from the valley station, one a day. A report wants one number per week. A chart wants a smooth curve without the day-to-day jitter. A forecasting model wants, for each day, what the temperature was the day before. All three are summaries over time. How do you compute them, and which of them is safe to feed to a model?
From the last lesson
1. 3 March 2025 is day 20150 since 1 January 1970. Which weekday is it, and why?
Show answer
Monday. 1 January 1970 was a Thursday (weekday 3), and (3 + 20150) mod 7 = 0, which is Monday.
2. How many rows does ts.loc["2025-03-10":"2025-03-12"] return on a daily index?
Show answer
Three. A slice of date labels keeps both of its ends.
Intuition
Lesson P02.6.1 split rows into piles by a key, summarised each pile and stacked the results. Time can be the key. Resampling cuts the time axis into bins of equal length, such as weeks, and gives one value per bin. A rolling window does something different: it slides a window of a fixed number of rows along the series, one row at a time, and gives one value per row.
P02.7.2-F1
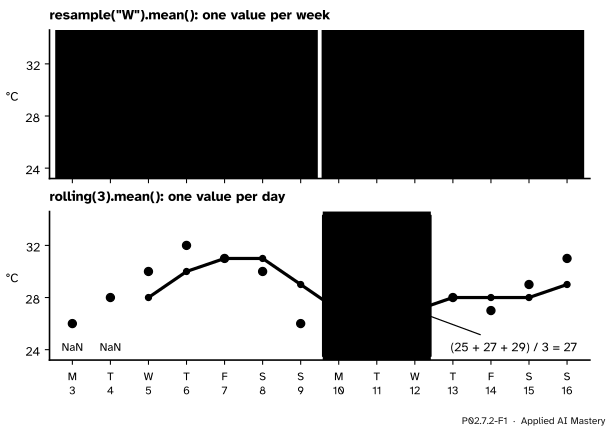
Two summaries over time. Resampling gives one value per bin; a rolling window gives one value per day, from the days in a window that slides.
Read the two panels. The top one has 2 numbers, one per week, and each week is named by the Sunday that ends it. The bottom one has 14 places for numbers, one per day, but the first two are missing: on Monday and Tuesday there are not yet three days to average. The rolling line is smoother than the dots, because each point on it is an average of three of them.
Build it up
Step 1. Weekly means with a dict. Walk through the days. For each one, work out the Sunday that ends its week (Monday plus 6 days, Tuesday plus 5, and so on) and use it as the key of a dict of lists, as in P02.6.1. Then take the mean of each list: 29 for the week ending Sunday 9 March and 28 for the week ending Sunday 16 March.
Step 2. The same with resample.ts.resample("W").mean() does exactly that. "W" means weekly bins that end on Sunday, and each bin is labelled by its right end, the Sunday. Any summary works in place of mean: .min(), .max(), or .agg(["mean", "min", "max"]) for all three at once.
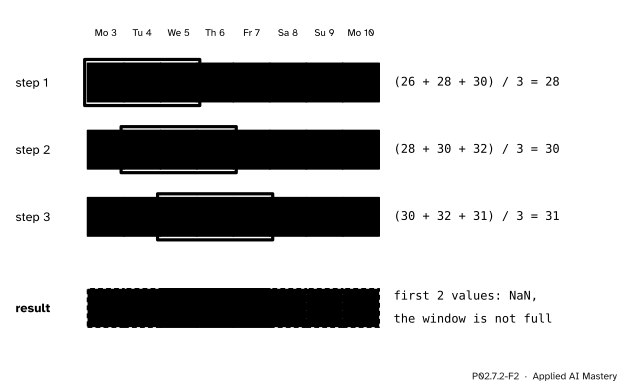
Step 3. A 3-day mean with a sliding loop. For each day \(i\), take that day and the two before it, and average them. On the first two days there are not three values yet, so the result is missing.
P02.7.2-F2
A trailing window of 3 slides one day at a time. Each position gives one mean, placed on the window’s last day.
Step 4. The same with rolling.ts.rolling(3).mean() slides the window for you. Its first two values are NaN, as in the loop.
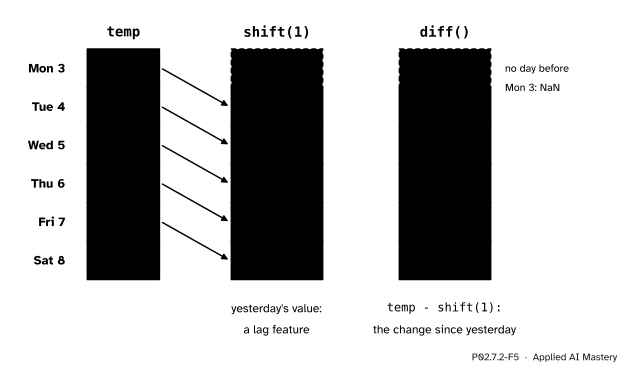
Step 5. Yesterday as a feature. To predict today’s temperature, a model may use yesterday’s. ts.shift(1) moves every value one row down, so the row for Tuesday holds Monday’s temperature; the first row has nothing to receive and becomes NaN. ts.diff() is the value minus the one before, the change since yesterday. Columns made like this are called lag features, and they are the raw material of forecasting.
The formal statement
Write the series as \(x_0, x_1, \dots, x_{n-1}\), one value per row, in time order.
NoteDefinition: resample, rolling, shift and diff
ts.resample(freq) cuts the time axis into bins of length freq and groups the rows by bin. For "W" (the same as "W-SUN") each bin runs from just after one Sunday to the end of the next Sunday; it is closed on the right and labelled on the right, by its Sunday. A summary such as .mean() then gives one value per bin.
ts.rolling(w).mean() gives, at row \(i\), the mean of the window of rows \(i - w + 1\) to \(i\), which trails row \(i\). The result is NaN until the window is full, because min_periods defaults to \(w\).
ts.rolling(w, center=True) labels each window by its middle row instead. For an even \(w\) the middle falls between two rows, and pandas uses the later one.
ts.shift(k) holds \(x_{i-k}\) at row \(i\), and NaN where \(i - k < 0\). ts.diff() is ts - ts.shift(1).
Fact 1: a trailing window has \(w - 1\) missing values, all at the start. The window of row \(i\) starts at row \({i - w + 1}\), which exists only when \({i \ge w - 1}\). So rows \(0\) to \(w - 2\), which is \(w - 1\) rows, have no full window. For \(w = 3\) that is the 2 missing values of the figure.
Fact 2: each step adds one value and drops one. Write the windows of rows \(i\) and \(i - 1\) side by side. They share the rows \(i - w + 1\) to \(i - 1\). Row \(i\)’s window has \(x_i\) as well, and row \(i - 1\)’s window has \(x_{i-w}\) as well. Subtract the two sums: the shared values cancel, and
\[
w\,m_i - w\,m_{i-1} = x_i - x_{i-w}.
\]
Divide by \(w\) and move \(m_{i-1}\) to the right:
\[
m_i = m_{i-1} + \frac{x_i - x_{i-w}}{w}.
\]
This is how a rolling mean can be updated in constant time per row, and it gives a quick check by hand: from \(m_2 = 28\), the next value is \({28 + (32 - 26) / 3 = 30}\).
Fact 3: weekly bins are every seventh 7-day window. A 7-day trailing window that ends on a Sunday covers exactly that Sunday’s week, Monday to Sunday. So ts.rolling(7).mean() read on the two Sundays gives 29 and 28, the weekly means of resample("W").
P02.7.2-F5
shift(1) slides the values down one row, so each day sees yesterday; diff() is today minus yesterday. The first row has no yesterday.
Worked example
Compute the weekly means and the 3-day rolling mean of valley_fortnight by hand.
P02.7.2-F3
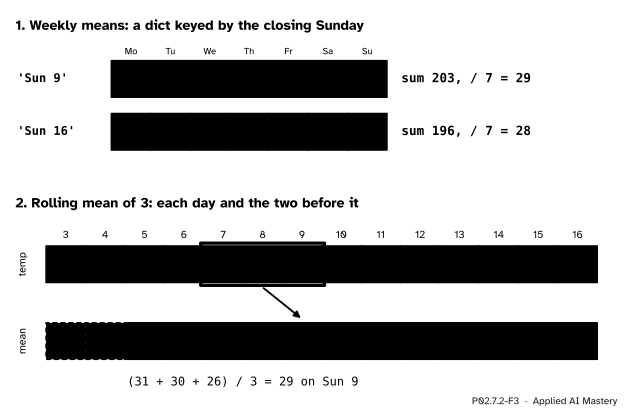
The worked example as a trace: two weekly piles, then the window over every day.
Weekly. The first week, Monday 3 to Sunday 9 March, holds 26, 28, 30, 32, 31, 30, 26. Their sum is 203 and 203 / 7 = 29. The second week holds 25, 27, 29, 28, 27, 29, 31, with sum 196, and 196 / 7 = 28. The two weekly means are whole numbers, as the course’s data were chosen to be.
Rolling. The first full window is Monday to Wednesday: (26 + 28 + 30) / 3 = 84 / 3 = 28, placed on Wednesday 5. Then, using Fact 2 for each step:
Carrying on to the end gives 27, 26, 27, 28, 28, 28, 29. Every one of the twelve means is a whole number. With the two missing values in front, the result has 14 entries, one per day.
Code
From scratch: a dict keyed by the closing Sunday, and a sliding loop.
import datetime as dtimport numpy as npimport pandas as pdvalley = [26, 28, 30, 32, 31, 30, 26, 25, 27, 29, 28, 27, 29, 31]start = dt.date(2025, 3, 3)days = [start + dt.timedelta(days=k) for k inrange(14)]weeks = {}for day, temp inzip(days, valley): sunday = day + dt.timedelta(days=6- day.weekday()) # the Sunday that closes this week weeks.setdefault(sunday, []).append(temp)weekly = {sunday: sum(temps) /len(temps) for sunday, temps in weeks.items()}print(weekly)def rolling_mean(values, w): out = []for i inrange(len(values)):if i < w -1: out.append(None) # the window is not full yetelse: out.append(sum(values[i - w +1:i +1]) / w)return outprint(rolling_mean(valley, 3))
            mean  min  max
2025-03-09  29.0   26   32
2025-03-16  28.0   25   31
[nan, nan, 28.0, 30.0, 31.0, 31.0, 29.0, 27.0, 26.0, 27.0, 28.0, 28.0, 28.0, 29.0]
[29.0, 28.0]
Lag features, and a month-end bin.
features = pd.DataFrame({"temp": ts, "yesterday": ts.shift(1), "change": ts.diff()})print(features.head(4))print(ts.resample("ME").mean())
            temp  yesterday  change
2025-03-03    26        NaN     NaN
2025-03-04    28       26.0     2.0
2025-03-05    30       28.0     2.0
2025-03-06    32       30.0     2.0
2025-03-31    28.5
Freq: ME, Name: valley, dtype: float64
"ME" means month end: all 14 days fall in March, so there is one bin, labelled 31 March, with mean 399 / 14 = 28.5. In pandas 3 the old alias "M" raises a ValueError for resampling.
Explore
P02.7-X1
Resample and roll
Choose weekly bins with a summary, or a rolling window of 1 to 7 days, trailing or centred. Step the selected day along the fortnight to see which dots feed its value, and watch the count of missing values change with the window.
Pitfalls
P02.7.2-F4
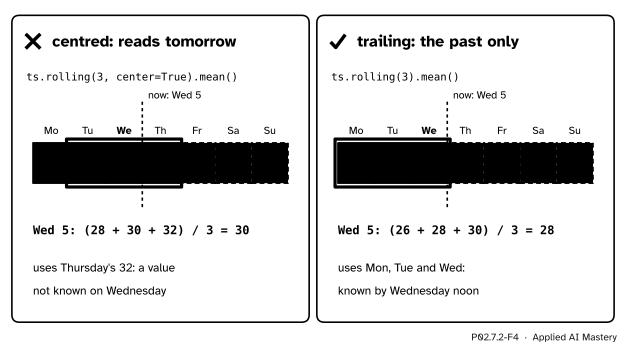
Wrong beside right. As a feature for Wednesday, the centred mean uses Thursday’s reading; the trailing mean uses only what was known on Wednesday.
“A centred window is the better average, so it makes the better feature.”
For a chart it can be: a centred moving average sits over the middle of its window and does not lag behind the curve. As a feature it is a leak. On Wednesday at noon, Thursday’s 32 °C has not been measured, yet rolling(3, center=True) puts it into Wednesday’s value. scikit-learn’s guide defines data leakage as using information that would not be available at prediction time when the model is built. A model trained on such features looks better in testing than it can ever be in use. For features, use trailing windows, and shift them if the target is the same day.
“rolling(3) means three days.”
It means three rows. If Wednesday’s reading is missing from the file, the window on Thursday is Monday’s, Tuesday’s and Thursday’s rows, which span four days: (26 + 28 + 32) / 3 = 28.67. Give the window as a length of time, rolling("3D"), and pandas uses the rows within the last three days instead: on Thursday, Tuesday and Thursday, (28 + 32) / 2 = 30. Time-based windows use min_periods=1 by default, so they have no missing values at the start.
“The row labelled 9 March is the week that starts on 9 March.”
It is the week that ends on Sunday 9 March. Weekly bins are labelled on the right by default. Passing label="left" and closed="left" to resample("W") does not just rename these weeks: it makes new ones, Sunday to Saturday, named 2, 9 and 16 March, with means 29.5, 27.29 and 31. For weeks from Monday named by their Monday, anchor them on Monday, resample("W-MON", closed="left", label="left"), which gives 29 and 28 labelled 3 and 10 March. Check which you got by looking at the labels and the number of rows.
“resample("M") gives monthly means.”
It did in older pandas. In pandas 3 month-end bins are "ME", and "M" raises a ValueError when resampling. Code copied from an older tutorial needs that change.
Check yourself
Recall
1. What is the difference between resampling and a rolling window?
Show answer
Resampling cuts time into bins and gives one value per bin. A rolling window slides along the rows and gives one value per row, from the rows in the window.
2. What does ts.resample("W").mean() give for valley_fortnight, and how are the rows labelled?
Show answer
29 and 28, labelled Sunday 9 March and Sunday 16 March, the Sundays that close each week.
3. How many missing values does ts.rolling(5).mean() have, and where?
Show answer
Four, the first four rows: a trailing window of \(w\) rows has \(w - 1\) missing values at the start.
4. What does ts.shift(1) hold on Tuesday 4 March, and what is ts.diff() there?
Show answer
Monday’s 26. The difference is 28 − 26 = 2.
5. Why must a feature not use center=True?
Show answer
A centred window includes rows after the current one, so the feature uses values from the future that would not be known at prediction time: a leak.
Exercises
1.★ Write down the first four values of ts.rolling(2).mean() for valley_fortnight by hand, and say how many are missing.
Show solution
The window is each day and the one before. Monday has no day before, so it is NaN. Then (26 + 28) / 2 = 27, (28 + 30) / 2 = 29 and (30 + 32) / 2 = 31. One value is missing, \(w - 1 = 1\).
2.★★ The 3-day trailing mean on Sunday 9 March is 29. Use the update rule to find the value on Monday 10 March, then check it directly.
Show solution
The value entering is Monday 10’s 25; the value leaving is the one three rows back, Friday 7’s 31. So \(m = 29 + {(25 - 31) / 3} = 29 - 2 = 27\). Directly, the window is Saturday, Sunday and Monday: (30 + 26 + 25) / 3 = 81 / 3 = 27.
3.★★★ Two forecasts for each day. Persistence predicts yesterday’s value, ts.shift(1). Moving average predicts the mean of the three days before, ts.rolling(3).mean().shift(1). Over the days where both exist, which has the smaller mean absolute error? Why is the .shift(1) needed in the second?
Show solution
The moving-average forecast first exists on Thursday 6 (the mean of Monday to Wednesday), so compare from Thursday 6 to Sunday 16, 11 days. The persistence errors there are the absolute changes from day to day: 2, 1, 1, 4, 1, 2, 2, 1, 1, 2, 2, which sum to 19, a mean of 19 / 11 ≈ 1.73. The moving-average errors are 4, 1, 1, 5, 4, 0, 3, 1, 1, 1, 3, which sum to 24, a mean of 24 / 11 ≈ 2.18. On this fortnight, yesterday is the better guess. Without the shift, the window would end on the day being predicted and include the answer itself: the forecast would use today’s temperature to predict today.
Summary card
Resample: one value per bin of time. Rolling: one value per row, from a sliding window.
P02.7.2-F1
Bins above, a sliding window below.
ts.resample("W").mean(): weeks closed and labelled on the right, by Sunday. Month end is "ME".
ts.rolling(w).mean(): trailing, \(w - 1\) missing values at the start.
Update rule: new mean = old mean + (value in − value out) / \(w\).
shift(1) is yesterday, diff() is the change: lag features.
Features use trailing windows only; center=True leaks the future.
Sources and next steps
Sources. Each was opened and checked against this lesson on 15 November 2026.
pandas developers, Time series / date functionality, pandas 3.1.1 User Guide. The offset alias W is weekly frequency anchored to Sunday, the same as W-SUN, and ME is the month-end frequency.
pandas developers, pandas.Series.resample, pandas 3.1.1 API reference. closed and label default to 'right' for 'W', 'ME' and the other end-anchored frequencies, and to 'left' for all others.
pandas developers, Windowing operations, pandas 3.1.1 User Guide. min_periods defaults to the window size for fixed windows and to 1 for time-based windows; by default the labels are set to the right edge of the window, and center sets them at the centre.
Rob J Hyndman and George Athanasopoulos, Forecasting: Principles and Practice, 3rd edition, section 3.3 Moving averages: the moving average of order \(m\) as the mean of the observations within \(k\) periods of time \(t\), and centred moving averages of even order.
scikit-learn developers, Common pitfalls and recommended practices, section 12.2: data leakage occurs when information that would not be available at prediction time is used when building the model.